Skip to content
QuorlyticTalk to a Data ExpertContact
Menu
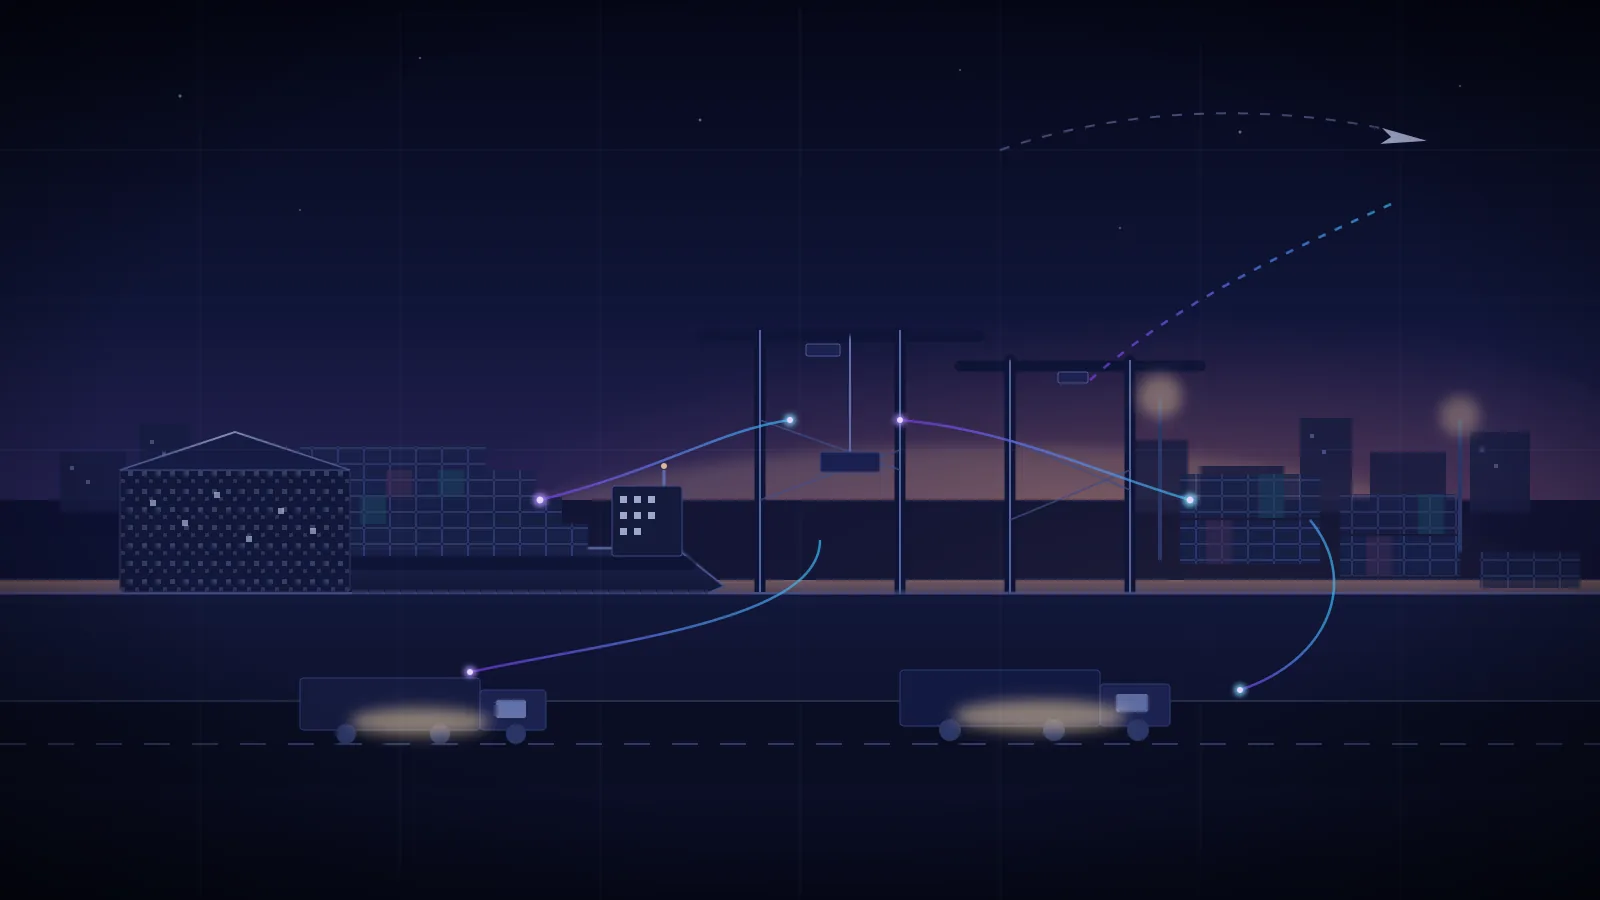
Illustration: a container port at dusk with gantry cranes, stacked containers, road freight and an aircraft, threaded with luminous event paths between them.

Industry / Logistics

Data & AI for logistics decisions that cannot wait.

Data and AI for logistics connects shipment, fleet and partner data into a timely, reconciled view of the network, so operations and planning teams act on the same reality instead of separately maintained numbers. Quorlytic sets a freshness target per decision rather than defaulting to real-time, and ties every exception to an owner and a next action.

By QuorlyticUpdated

A shipment is described by many systems and by no single one of them. Visibility is not the absence of statuses; it is events that agree on identity, time, place and business meaning — which is a data problem before it is an analytics problem.

  • Event time preserved
  • Identity resolved once
  • Freshness per decision
  • Exception has an owner
  • From event to decisionShipment events that agree on identity, place and time
  • Freshness by decisionBatch where batch is enough; near-real-time only where it changes the call
  • Exceptions with ownersEvery alert points to a shipment, a lane and a next action
  • Settlement reconciledDelivered, charged and paid amounts reconciled to one version of the move

Lifecycle

The shipment lifecycle, and where its data breaks

Eight stages, and the hand-offs between them are where the data breaks. Each stage names the events it produces, the decision it exists to make, and the question the next stage has to answer with someone else's identifiers.

  1. Order and promise

    A customer commits to something: a quantity, a service level, a window, a price. The promise is a commitment recorded in one system and interpreted in several.

    Data
    Order lines, promised dates and windows, service level, commercial terms, customer and ship-to identity.
    Decision
    What was promised, to whom, and by when.
  2. Plan and book capacity

    Orders are consolidated into loads and assigned to a mode, a carrier and a lane. Planning happens before the physical move, so plans and actuals diverge immediately.

    Data
    Load plans, carrier allocations, lane and mode, planned departure and arrival, equipment identifiers.
    Decision
    Which capacity is committed, and what happens if it is not.
  3. Pickup and first scan

    The move becomes physical. A driver, a yard or a dock records it with whatever identifier is nearest to hand — often a stop number, not the order number.

    Data
    Pickup events, stop and facility identifiers, vehicle and driver references, seal numbers, timestamps.
    Decision
    Did the shipment actually start, and is the record attached to the right order.
  4. Hub, terminal and border

    Cross-dock, terminal handling and customs clearance each generate their own events, in their own vocabulary, often sharing no common key with the order.

    Data
    Terminal and port events, handling units, customs status and declarations, demurrage clocks.
    Decision
    Where the consignment is, which hand-offs completed, and what is waiting on paperwork.
  5. In transit and telemetry

    Position arrives from telematics, carrier feeds and partner APIs at different intervals. Position is not status: a moving vehicle says nothing about whether the plan is still achievable.

    Data
    GPS and telematics pings, carrier milestones, ETA updates, route and lane context, exception feeds.
    Decision
    Which shipments are drifting from the promise, and how confident that signal is.
  6. Exception and recovery

    Something breaks the promise: weather, a missed connection, a refused delivery, a customs hold. The useful question is not that it happened but which exception deserves attention now.

    Data
    Exception type and reason code, severity, dwell and delay durations, customer impact, recovery options.
    Decision
    Which exception gets a person, a reroute or a credit.
  7. Delivery and proof

    Delivery is recorded by whoever completes it, sometimes after the fact and sometimes partially. Partial, refused and unattended deliveries are the normal case, not the edge case.

    Data
    Delivery events, proof of delivery, signature or photo references, partial and refused quantities, returns.
    Decision
    What was actually received, and what obligation is now complete.
  8. Settlement and cost to serve

    Charges arrive from carriers, terminals and brokers, priced against a contract and a set of surcharges. Accessorial charges and disputes are where the recorded move and the invoiced move diverge.

    Data
    Freight invoices and audit records, accessorial charges, contract rates, accruals, dispute status.
    Decision
    What the move cost, what should be paid, and which charge is wrong.

Where it breaks

Where logistics data estates break

Four failures account for most of the distance between a tracking screen and a decision. None of them is fixed by buying more visibility.

Planned and actual times in one column

Planning data and execution data are modelled in the same table, so an ETA column contains a promise, a revised promise and an observed event with no way to tell which.

What it costsOn-time performance is computed from mixed semantics, and the number cannot be defended in a review.

Identifiers that do not survive the hand-off

The order number, the shipment number and the handling unit are three different keys held by three different parties; joins happen on whatever the interface happened to send.

What it costsEvents attach to the wrong consignment, or to none, and reconciliation becomes manual forensic work.

Event order mistaken for arrival order

Carrier and partner feeds arrive in batches, retry, and occasionally replay, so ingestion order is not event order and duplicates look like progress.

What it costsStatus regresses, ETAs oscillate, and operators stop trusting the screen they were given.

Exceptions without an owner

Alerts are generated by threshold rather than by decision, so the volume exceeds anyone's capacity to act and the queue is ignored.

What it costsThe same exceptions recur, and the cost appears in service failures and accessorial charges rather than in a dashboard.

Functions

What each logistics function owns

Five functions, each owning a question rather than a report. The data a function needs is usually produced by the function next to it.

Logistics functions, the question each owns and the data that answers it
FunctionThe question it ownsData it needsAnalyticsDecision
Transport operationsWhich shipments need intervention before the next window?Order promise, planned versus actual movement, carrier milestones, exception feedsPromise-risk scoring, exception ranking, dwell and delay analysisReroute, expedite, notify or accept the delay
Network & capacity planningWhere should scarce capacity be committed next week?Load plans, lane history, carrier availability, equipment positions, terminal throughputLane and mode capacity modelling, scenario comparison, cost-to-serve by laneAllocate capacity, adjust the network plan, renegotiate the lane
Warehouse & inventoryWhat has to be ready to ship, and when?Stock positions, inbound arrivals, pick and pack status, handling unit identityAvailability-to-promise, workload levelling, dock and labour planningSequence work, move stock, release or hold the order
Customer serviceWhat do we tell the customer, and when?Promised versus projected arrival, exception history, proof of delivery, claimsConfidence-banded ETA, impact segmentation, contact prioritisationNotify, offer an alternative, adjust the promise forward
Finance & settlementWhat did this move cost, and is the charge correct?Freight invoices, contracted rates, accessorial charges, delivery evidence, accrualsInvoice audit, accessorial attribution, cost-to-serve by lane and customerApprove, dispute or accrue

Decisions

Four logistics decisions, traced end to end

Four decisions, each traced from the question to the measurement — including what the analysis does not settle.

Which shipments are likely to miss the promise?

  1. Question
  2. Data
  3. Analytics
  4. Decision
  5. Measurement

Data required

  • Order promise with service level and window
  • Planned versus actual movement, by stop or leg
  • Carrier milestone feeds with event time preserved
  • Dwell times at hub, terminal and border
  • Exception history for the same lane and carrier

Analytics

  • An ETA distribution rather than a single time, refreshed as events arrive
  • Promise-risk scoring separated from raw delay duration
  • Segment error reporting by lane, mode, carrier and customer type

Decision

Intervene on the shipments where the risk is high and the intervention still changes the outcome

Measurement

  • On-time performance against the original promise, not the last revision
  • Intervention effectiveness: did acting early change the outcome
  • Alert precision, so the queue stays actionable

What this does not settleThis does not predict with certainty, and it does not replace the operator's knowledge of a specific customer or lane. Where history is thin — a new lane, a first-time carrier — the honest output is a wide band and an explicit low-confidence flag rather than a confident number.

Where should scarce lane, carrier and hub capacity be committed?

  1. Question
  2. Data
  3. Analytics
  4. Decision
  5. Measurement

Data required

  • Committed and forecast volume by lane, mode and week
  • Carrier and equipment availability, including contracted capacity
  • Terminal and hub throughput limits and dwell history
  • Cost per lane, accessorial rates and service commitments

Analytics

  • Capacity and demand compared at the planning grain, not the reporting grain
  • Scenario comparison for allocation choices and their cost
  • Service-level impact estimated per allocation option

Decision

Commit capacity to the lanes and windows that protect the service commitments that matter most

Measurement

  • Capacity utilisation against plan
  • Cost per unit moved by lane and mode
  • Service level by allocation scenario actually chosen

What this does not settleThe plan is a commitment under uncertainty: carrier behaviour, weather and customer demand all move. The analysis supports a decision about allocation; it does not produce an optimal network, and treating a scenario model as an optimiser is how planning loses credibility.

Which exception deserves human attention now?

  1. Question
  2. Data
  3. Analytics
  4. Decision
  5. Measurement

Data required

  • Exception events with type, reason code and event time
  • Severity, customer impact and remaining recovery options
  • Cost of the alternatives: expedite, reroute, credit or accept
  • The operating team's actual handling capacity this shift

Analytics

  • Exceptions ranked by decision value rather than by delay duration
  • Impact scoring that separates customer consequence from internal noise
  • Queue sizing against the capacity that exists to work it

Decision

Assign the exceptions that a person can still change, and let the rest be handled by rule

Measurement

  • Time from exception to first action
  • Share of exceptions resolved by rule rather than by escalation
  • Recurrence of the same cause on the same lane

What this does not settleRanking cannot invent capacity. If the queue is larger than the team, the honest options are changing the rule that generates alerts or accepting a slower response — and that is an operational decision, not an analytics one.

What actually happened between booking, movement, delivery and settlement?

  1. Question
  2. Data
  3. Analytics
  4. Decision
  5. Measurement

Data required

  • The order, shipment and handling-unit identities across parties
  • Events from every participant, with event time and source
  • Proof of delivery, partial deliveries, refusals and returns
  • Invoices, contracted rates and accessorial charges

Analytics

  • One reconciled event timeline per shipment across carriers and systems
  • Reconciliation of delivered quantity against invoiced quantity
  • Attribution of delays and charges to the party and stage that caused them

Decision

Settle the move, dispute the charge, and correct the process that produced the mismatch

Measurement

  • Reconciliation rate between delivery evidence and invoice
  • Value and volume of accessorial charges disputed and upheld
  • Time to close a shipment record after delivery

What this does not settleReconciliation depends on every party returning the identifiers they were given. Where a carrier or terminal cannot, the record is completed from evidence rather than assumed — and the completeness of that evidence is stated rather than smoothed over.

Illustrative interface

An exception control tower over one reconciled event timeline

A reference interface, not a Quorlytic product and not a client screen. It shows the shape of the screen this decision would be made on: one row per exception, with the signal, its freshness and a named owner. No figure here is a result.

An exception control tower over one reconciled event timeline
Shipment and laneSignalEvent freshnessOwnerNext action
Risk: Consignment 4417 · Rotterdam → LeedsPromise risk high · ETA band +6h to +14h11 minLane owner · EU roadOffer revised window
Watch: Consignment 4380 · Singapore → HamburgDwell above plan at transhipment42 minTerminal liaisonConfirm berth slot
Watch: Consignment 4399 · Chicago → DenverMilestone missing since pickup3 h 05 minCarrier managerChase carrier feed
OK: Consignment 4361 · Pune → ChennaiRecovered after reroute8 minLane owner · IN roadClose and record cause
Risk: Consignment 4402 · Felixstowe → DublinCustoms hold · paperwork incomplete27 minCustoms deskRequest corrected declaration
  • Risk: the promise is at stake and the window to act is closing
  • Watch: drifting, but a rule or a routine check can still resolve it
  • OK: resolved and recorded, kept visible so the cause can be reviewed

Data foundation

The logistics data foundation

The foundation exists to make events from different parties comparable. It resolves identity across systems, preserves event time separately from arrival time, and encodes the status vocabulary once so reporting does not re-invent it per carrier.

  1. Source systems

    Each one names the same move differently. The ten systems are enumerated in the inventory below.

    • Order and transport management
    • Carrier and partner feeds
    • Facility and yard systems
    • Telematics and device events
  2. Event ingestion

    Event time preserved separately from arrival time

    • Carrier EDI and API intake
    • Scan and device event streams
    • Batch extracts from order and transport systems
    • Replay after a partner outage
  3. Cloud platform

    One place the whole move can be reconstructed

    • Raw landing with original timestamps
    • Validated and deduplicated events
    • Shipment and lane models
  4. Identity & linkage

    The layer that decides whether two events are one move

    • Shipment, order and consignment mapping
    • Stop, facility and location reference
    • Equipment and container identity
    • Partner-to-internal code mapping
  5. Quality & contracts

    A breach fails a build, not an inbox

    • Declared event schemas per partner
    • Out-of-order and duplicate event handling
    • Freshness targets stated per decision
    • Lineage from status back to source event
  6. Operational models

    One version of the move

    • Milestone and dwell models
    • Exception classification with owners
    • Lane and carrier performance
    • Cost-to-serve and settlement
  7. Decision surfaces

    Where planners and control towers work

    • Shipment and lane visibility
    • Exception queues with next actions
    • Capacity and commitment views
    • Settlement reconciliation
  8. Action

    A decision with an owner and a measurement

    • Re-plan and re-route
    • Customer commitment updates
    • Carrier allocation changes
    • Claim and dispute handling
Reference architecture — a target-state shape, not a description of a client engagement.

Status normalisation belongs here rather than in each report. One agreed vocabulary — with the provider's own code retained alongside it — is what allows a lane, a carrier or a week to be compared without somebody re-interpreting the meaning of a code. A carrier correction can arrive after an exception has been acted on. The streaming delivery and correction contract should specify which consumer receives the corrected shipment state and how that acknowledgement is recorded.

10 source systems, and what to check before trusting each
  • Order management (OMS)

    The promise: service level, window, commercial terms and customer identity

    Check before trustingAmendments that overwrite the original promise without keeping the version it replaced

  • Transport management (TMS)

    Load and route plans, carrier allocation, planned versus executed legs

    Check before trustingPlans edited after execution without an audit trail, so the plan looks like it was right

  • Warehouse management (WMS)

    Stock positions, pick and pack progress, handling-unit identity

    Check before trustingHandling units re-labelled at pick, breaking the link to the order identifier

  • Carrier and partner APIs

    Milestones, status codes and ETA updates in each provider's own vocabulary

    Check before trustingStatus vocabularies that map many-to-one onto yours, and updates that arrive out of order

  • EDI and messaging

    Contractual event exchange with partners: despatch, arrival, proof of delivery

    Check before trustingBatch delivery times that make ingestion order differ from event order

  • Telematics and GPS

    Position and movement, at whatever interval the device reports

    Check before trustingPosition treated as status: a moving vehicle is not evidence that the promise holds

  • Terminal, port and yard systems

    Handling, berth and gate events, container and equipment identity, free-time clocks

    Check before trustingIdentifiers that stop at the terminal boundary and cannot be joined to the order

  • Customs and border systems

    Declarations, clearance status and holds

    Check before trustingStatus changes that announce a hold without saying what would clear it

  • Freight audit and settlement

    Invoices, contracted rates, accessorial charges and disputes

    Check before trustingCharges priced against the booked move rather than the move that happened

  • Customer promise and service systems

    What the customer was told, and when the message changed

    Check before trustingPromise revisions kept only in a communication log, invisible to reporting

Analytics & AI

From reconciled movement to network learning

Each rung is only worth building once the one below it holds. Skipping a rung is how a network ends up with a prediction nobody can reconcile.

  1. Reconciled operational reporting

    One timeline per shipment, one definition of on-time, and a reconciliation of planned, actual and invoiced movement.

    RequiresIdentity resolution across order, shipment and handling unit, with event time preserved

  2. Exception analytics

    Exceptions clustered by cause, lane and stage, sized against the team that has to work them.

    RequiresA normalised status vocabulary and a reason code that means the same thing across partners

  3. Promise-risk and ETA analysis

    Confidence-banded arrival estimates, evaluated by lane and by customer type rather than as a single accuracy claim.

    RequiresEnough history per lane, with stockouts, holds and reroutes visible rather than smoothed away

  4. Cost-to-serve analysis

    Lane, mode and accessorial cost attributed to the move that incurred it, alongside the service level it bought.

    RequiresSettlement data reconciled to delivery evidence, not to the booked plan

  5. Learning from exceptions

    Decisions and their outcomes recorded, so the rules that generate alerts are improved rather than accumulated.

    RequiresAn owned exception process with outcomes captured at the point of decision

Maturity

A maturity progression, with readiness tests

Most networks recognise themselves in one of these stages. The readiness test matters more than the label: it says what has to be true before the next stage is worth attempting.

  1. Fragmented visibility

    Each party reports what it can see; status is reconciled by export, spreadsheet and phone call.

    Ready for the next stage whenA single shipment can be traced end to end without a manual reconstruction

  2. Reconciled operations

    One timeline per shipment and one definition of on-time; exceptions are listed but worked by hand.

    Ready for the next stage whenExceptions are ranked by consequence and each one has a named owner

  3. Decision support

    Promise risk, capacity options and cost-to-serve are visible at the cadence each decision runs at.

    Ready for the next stage whenThe analysis is measured against the decision it informed, not against model output alone

  4. Operated network

    Alert rules, thresholds and overrides are owned, reviewed and changed deliberately as the network changes.

    Ready for the next stage whenA rule change can be evaluated against its effect on service and cost before it is left in place

Measurement

What a logistics organisation should measure

What a logistics organisation should measure, and which decision each measure informs.

Common logistics measures, what they capture and the decision they inform
MeasureWhat it capturesDecision it informs
On-time performance against original promiseWhether the commitment made at order was met, including subsequent revisionsWhere service recovery and lane intervention are needed
Event completeness and freshnessShare of shipments with a complete timeline, and how current it isWhether a status view can be trusted right now
Exception rate and resolution timeExceptions per hundred shipments, and time from event to actionWhether the exception process or the lane itself needs work
Dwell by facility and stageTime spent at hub, terminal and border, separated from transit timeWhere a facility constraint is distorting the plan
Capacity utilisation against planCommitted capacity actually used, by lane, mode and weekWhere allocation or carrier agreements need revisiting
Cost per unit movedFreight, accessorials and handling attributed to the moveWhich lane, mode or customer is unprofitable to serve as priced
Invoice reconciliation rateShare of charges matched to delivery evidence without manual adjustmentWhere contracts, rate cards or evidence capture need fixing
Claim and damage incidenceClaims by stage, lane and handling unit typeWhere packaging, handling or a partner needs attention

These are measures a logistics organisation would track for itself, with the reading most teams give them. They are not results Quorlytic has produced, and their definitions vary between organisations — and, often, between carriers inside the same organisation.

Principles

Principles we work to

The 3 principles this work is built on
  1. 01

    Match freshness to the decision

    Route changes, exceptions and customer updates may need near-real-time data, while monthly cost analysis does not. Set a freshness target per decision and choose the simplest architecture that meets it. Streaming is justified by the decision, not by fashion.

  2. 02

    Reconcile events and records

    Shipment events, system records and partner feeds rarely agree. Model them with clear event-time and identifiers, and reconcile against the operational source of truth. Late or missing scans should be visible rather than silently averaged away.

  3. 03

    Make exceptions actionable

    A useful view points to the shipment or lane that needs attention. Connect alerts to an owner and a next action, and record outcomes so the process improves. Dashboards without a follow-up path do not change operations.

    • Shipment and network visibility
    • On-time, cost and exception analysis
    • Demand and capacity planning support

Engagement

How an engagement can progress

A sequence that starts with one lane and one decision, and ends with a network that is operated rather than observed.

  1. Map the network

    OutputThe participants, systems and event feeds behind one lane or trade, with the identifiers each one uses

  2. Audit the events

    OutputA source and quality map: what arrives, how late, with which identifiers and what is missing

  3. Design the foundation

    OutputA target-state design for identity, event time, status normalisation and the decision surfaces above them

  4. Build the reconciled timeline

    OutputPipelines, identity resolution and quality gates producing one shipment timeline with freshness visible

  5. Build the first decision

    OutputThe promise-risk or exception analysis the operation actually asks for, evaluated against what the data supports

  6. Operationalise

    OutputAlert ownership, threshold review and recovery runbooks, with the cause of exceptions fed back into the rules

Where this connects

Capabilities that support these decisions

Further reading, chosen for this lifecycle

Questions

Questions worth asking.

Do we need real-time tracking data?

Only where the decision loses value at batch latency. Compare a freshness target against the simplest architecture before adding streaming complexity and its operational cost.

Your next data decision

Start with a clear problem.
Build what comes next.

Talk to a Data Expert

Bring the business question.
We'll help shape the engineering brief.