Skip to content
QuorlyticTalk to a Data ExpertContact
Menu

Case studies

Client work, documented as engineering.

Quorlytic client case studies: the situation, the architecture delivered and what it enabled, published with client approval and without invented figures.

Published case studies

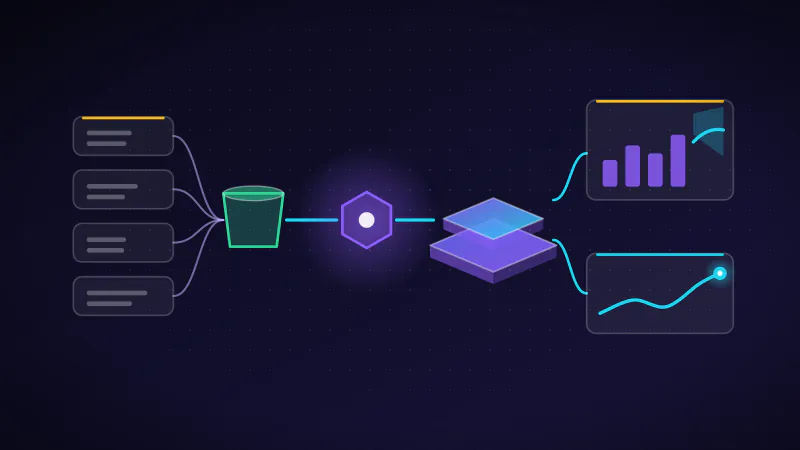
Illustration: operational sources flowing through ingestion and ETL into a curated data platform, feeding reports and a demand forecast.
  • Manufacturing
  • Data Engineering
  • Analytics
  • Machine Learning
  • AWS

An AWS data platform for manufacturing demand intelligence

Quorlytic built an end-to-end data platform on AWS for a manufacturing enterprise. Automated ingestion and ETL brought ERP, sales and order, production, inventory and spreadsheet data into a curated Amazon Redshift layer; Power BI reporting and a Python demand-forecasting capability were then built on that single, trusted foundation.

  • A single, curated data foundation in place of manually consolidated sources.
  • Repeatable pipelines in place of ad-hoc data preparation.
  • Business reporting built on one trusted analytical layer.
  • A forward-looking demand signal alongside historical reporting, to support planning.

Amazon S3AWS GlueAWS LambdaAmazon RedshiftPower BIPythonRead the case study

Related insights

Guides behind the work.

All engineering guides
Illustration: sources flowing through three processing stages into a destination store.

Engineering guideData Architecture

What Is a Data Pipeline?

What a data pipeline is, how batch, streaming and change data capture differ, and what production pipelines must guarantee to be trusted.

8 min read

Illustration: staging, core and mart layers stacked in a warehouse, serving downstream reports.

Engineering guidePlatform Engineering

Data Warehouse Architecture

Warehouse layers, grain, marts and semantic models: how to design a warehouse that answers the same question the same way every time.

9 min read

Illustration: a noisy signal becoming a forecast with a confidence band, leading to a decision.

Analytics guideAnalytics & BI

Predictive Analytics: From Signal to Action

How predictive analytics becomes a decision: model families, label quality, evaluation, intervention design and monitoring in production.

9 min read

Illustration: forecast errors counted three ways: equally, weighted by volume, and squared.

ComparisonData Architecture

MAPE vs WAPE vs RMSE

Which forecast accuracy metric to use and when: how MAPE, WAPE, RMSE and MAE behave on low-volume items, outliers and portfolio-level reporting.

12 min read

How we publish

Every study meets the same standard.

A study is published only with the client's written approval, and only when each field below can be answered without exaggeration. Where a client has not approved quoting figures, outcomes are described as capabilities, never as invented statistics.

  • SituationWhat the organisation was trying to decide, and what made it hard at the time.
  • ConstraintsRegulatory, timing, platform, budget or team limits that shaped the design.
  • ArchitectureWhat was built, the boundaries chosen and why the alternatives were rejected.
  • ImplementationThe sequence actually followed, including what changed during delivery.
  • Measurement methodHow the result was measured, by whom, over what period, and what was not measured.
  • OutcomeWhat changed, stated without invented statistics and without claiming credit for the client’s work.
  • LimitationsWhat remains open, unproven or dependent on the client’s operating model.
  • Technology stackThe platforms and tools used, as names only; no partnership or certification is implied.
  • Related servicesLinks to the Quorlytic capabilities that delivered and now operate the work.

Have a data foundation to build?

Tell us the decision you need to support. We will shape the engineering brief around it.