

Engineering guideData Architecture
What Is a Data Pipeline?
What a data pipeline is, how batch, streaming and change data capture differ, and what production pipelines must guarantee to be trusted.
8 min read
Case study · Manufacturing
Quorlytic engineered an AWS data platform that unified a manufacturer's ERP, sales, production and inventory data through automated ETL, put Power BI reporting on one trusted layer, and added a Python demand forecast built on the same history.
 By Deepesh Patel, Founder & Data EngineerUpdated
Summary
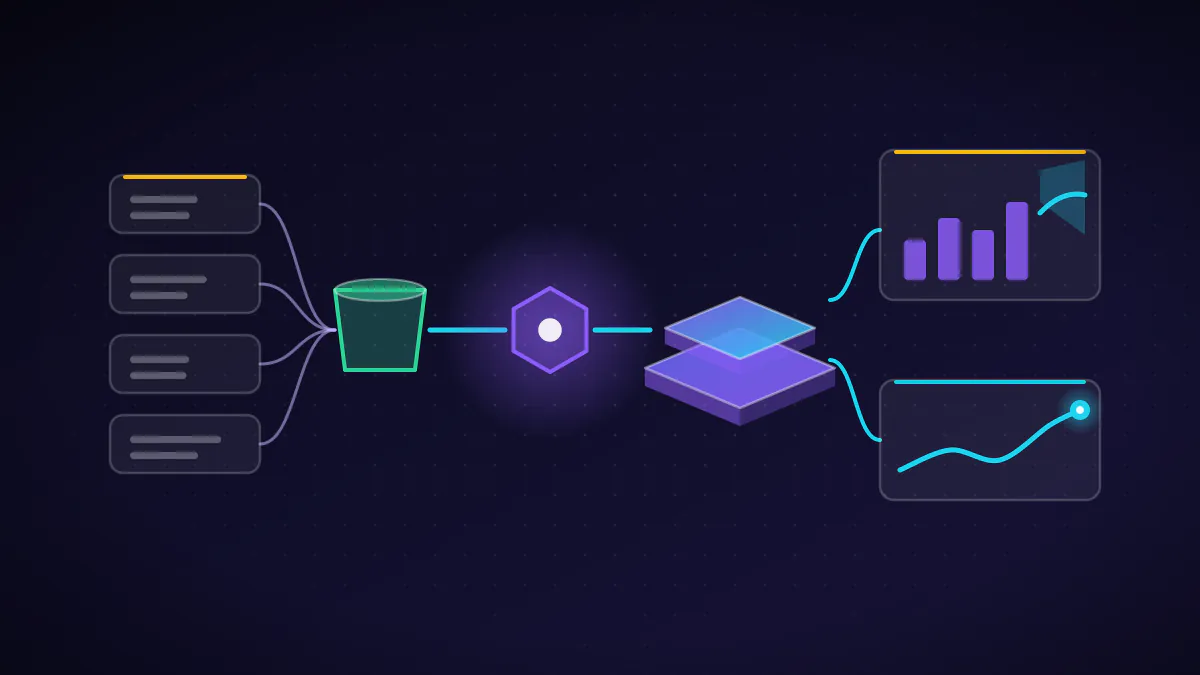
Quorlytic built an end-to-end data platform on AWS for a manufacturing enterprise. Automated ingestion and ETL brought ERP, sales and order, production, inventory and spreadsheet data into a curated Amazon Redshift layer; Power BI reporting and a Python demand-forecasting capability were then built on that single, trusted foundation.
Published Sep 27, 2026 · Client anonymised with their approval
The challenge
The organisation had the data it needed to plan. It did not have it in one place, in one shape, or in a form anyone could trust without rebuilding it by hand.
Before
After
The engineering approach
Reliable analytics and machine learning require reliable data. So the work started with the foundation, not the dashboard and not the model.
A dashboard built on manually consolidated data inherits every inconsistency in it, and a forecast trained on an unreliable history learns the inconsistency as if it were demand. Building ingestion, transformation and a curated layer first meant reporting and forecasting would share one definition of the history.
Stage one
Data from each source was brought automatically into a landing area in Amazon S3, so the platform no longer depended on someone exporting and sending files.
Stage two
AWS Glue ETL cleaned, standardised and integrated the sources into consistent datasets. This is where a transactional ERP and a hand-maintained spreadsheet were made to describe the same products, periods and quantities in the same way.
Stage three
The integrated data was modelled into a curated layer in Amazon Redshift: the single, trusted history that both reporting and forecasting read from.
Architecture
Each layer, the job it does, and the services that do it. Only services the engagement used are shown.
 Amazon S3
 AWS Lambda
 AWS Glue
 Amazon Redshift
 Power BI
 Python
Data quality
Business intelligence
Once the data was curated, reporting stopped being a consolidation exercise. Power BI read from the Redshift layer, so every report started from the same history.
Analytics layerIllustrativeMachine learning
Reporting explains what has already happened. Planning needs a view of what may happen next. Quorlytic added a demand-forecasting capability in Python, trained on the curated history the platform now held.
How to read the forecast. The forecast is a decision-support signal: a projection of likely demand to inform planning, not a certainty and not an automated decision.
Reporting and forecasting were not delivered as separate experiments. Both read the same curated history, so projected demand could sit next to actual performance in one view, and a planner compared like with like.
Decision intelligence
Power BI reporting on a single, curated history.
Trends and comparisons across sales, production and inventory data.
A demand forecast built on the same history.
Technology
Technologies used on this engagement. No partnership or certification is implied.
 AWSAmazon S3AWS LambdaAWS GlueAmazon RedshiftPower BIPython
Outcomes
Outcomes are described qualitatively. No figures from the client's environment are published, so no performance, accuracy, time or cost result is claimed.
Data that previously lived in separate systems and spreadsheets became available through one curated analytical layer.
Repeatable pipelines replaced manual, repeated consolidation.
Reporting and forecasting read the same curated data, so they describe the business the same way.
Power BI gave stakeholders one view across sales, production and inventory data.
A demand forecast added a projected view alongside historical reporting.
The platform gives future analytics or machine-learning work a curated history to start from.
Engineering insight
A useful forecast depends on:
Questions
What this study does not claim
An end-to-end data platform on AWS: automated ingestion and ETL into a curated Amazon Redshift layer, Power BI reporting on that layer, and a Python demand-forecasting capability built on the same history.
Amazon S3 held ingested data, AWS Lambda ran lightweight serverless steps, AWS Glue ran the ETL, and Amazon Redshift held the curated analytical layer.
The ETL cleaned, standardised and integrated ERP, sales and order, production, inventory and spreadsheet data into consistent, analysis-ready datasets, so reporting and forecasting could rely on one history.
Power BI reporting read from the curated Redshift layer, giving stakeholders one view across sales, production and inventory data, with forecast output alongside actual performance.
A demand-forecasting capability was developed in Python on the curated history, to give planning teams a projected view of demand. Its output is a decision-support estimate, not a certainty.
A forecast is only as reliable as the history it learns from. Building ingestion, transformation and a curated layer first gave the model, and the reports, one consistent and trusted history.
Related capabilities
Related insights
Engineering guideData Architecture
What a data pipeline is, how batch, streaming and change data capture differ, and what production pipelines must guarantee to be trusted.
8 min read

Engineering guidePlatform Engineering
Warehouse layers, grain, marts and semantic models: how to design a warehouse that answers the same question the same way every time.
9 min read

Analytics guideAnalytics & BI
How predictive analytics becomes a decision: model families, label quality, evaluation, intervention design and monitoring in production.
9 min read
ComparisonData Architecture
Which forecast accuracy metric to use and when: how MAPE, WAPE, RMSE and MAE behave on low-volume items, outliers and portfolio-level reporting.
12 min read
Quorlytic engineers data platforms, analytics systems and production machine learning that turn operational data into usable intelligence.